Technical analysis is important for anyone that actively trades securities. Trading cryptocurrency is no exception. One of the most popular tools for traders is called the Relative Strength Index, or RSI. This tool has been used to project the market movement of stocks, FOREX, and cryptocurrency. To effectively trade Bitcoin with the Relative Strength Index you will need to familiarize yourself with a few basic concepts.
Do Not Be Intimidated by Technical Analysis
Before we explain a little about the RSI and how it can be used to trade Bitcoin it is important for you to put aside any apprehension you may have about technical analysis tools. There is certainly a learning curve involved when it comes to reading charts, but the person of average intelligence can learn to spot patterns in the RSI.
Some people are intimidated by the use of the RSI and other trading tools. They mistakenly believe that a background in statistics or other technical fields is required. While there is complex technology behind these tools, using them primarily requires you to be able to spot patterns and trends. In other words, you don’t necessarily have to be an expert in how the tool functions in order to use it.
Put aside your fear of technical analysis if you want to be a strong Bitcoin trader. Trading without the use of trading tools is foolish, and it is no different that throwing darts at a board. You may get lucky every once in a while, but your gains will be inconsistent. Using tools increases the chance that you will make more winning trades. More winning trades equals more profit.
What is the Relative Strength Index?
The Relative Strength Index is classified as a momentum indicator. It is designed to measure and identify certain conditions that can result in a security being overbought or oversold. The premise behind the tool is that these conditions will correct. The RSI can be useful in predicting a market correction which can be profitable to the trader.
The magnitude of price changes in an asset are what provide the essential data for the RSI. The tool evaluates the strength of Bitcoin’s recent price performance within a given period of time. In most cases, traders like to work with a 14-day RSI. This is believed to be the minimum time frame in which reliable data can be collected. Some traders may alter this period. It should always be remembered that longer periods of data collection tend to produce more reliable conclusions.
The RSI was developed by J. Welles Wilder. It has been used by traders of many types of securities. The indicator is applicable to any type of security that is traded on a market which reflects changes in value by assigning securities a price. This means that the RSI can be used to track the momentum of Bitcoin and other cryptocurrencies.
How the RSI Works in Trading Bitcoin
An RSI chart is considered to be an oscillator. This means that it oscillates between two predefined extremes. For an RSI, this is a range of 0-100. The patterns on an RSI chart will fall somewhere in this predefined range.
When the price levels of a security are above 70 on an RSI chart, this likely indicates that the security is being overbought. When the price level is below 30, this similarly indicates that the security is being oversold. An appropriate correction could happen in the near future.
It should be noted that RSI ranges can vary according to the particular security that is being traded. For example, if Bitcoin were consistently trending above 70 on the RSI then it would be necessary to establish 80 as a more appropriate benchmark. The best way to determine the appropriate ranges would be to study historical charts and form opinions.
An RSI that shows a security in or around the 50 range means that there is not sufficient price action to merit a potential trading signal. This median price action indicates that there is no strong trend for the trader to take advantage of.
Here is an example of an RSI chart for Bitcoin:
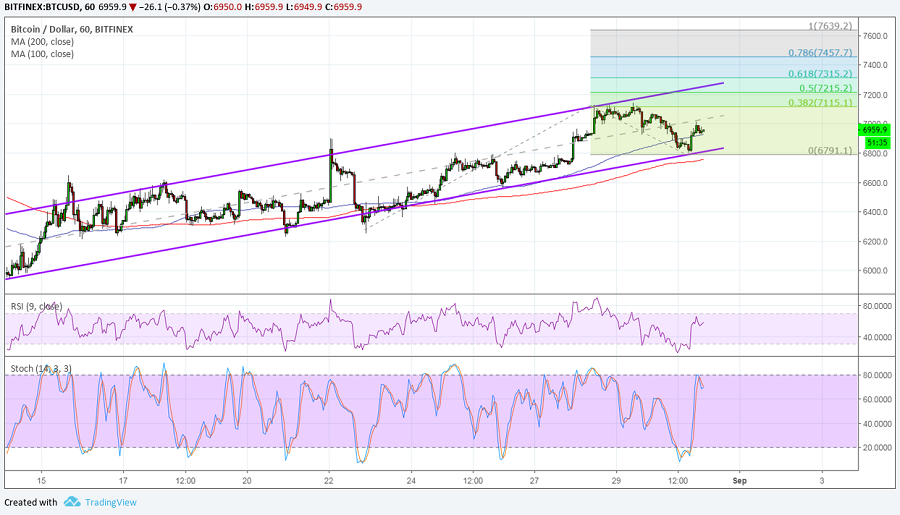
At the top of the image is a candlestick chart for the price of Bitcoin. Below this there is a chart for the RSI followed by another technical indicator at the bottom. Notice how the RSI can often be a strong predictor of a short-term trend reversal. As you will note, Bitcoin would be considered overbought when the RSI range crosses 80. Each time this has occurred in the above example, a corrective decline followed.
As you can see, gleaning information from an RSI does not take an abundance of technical expertise. One must simply learn to identify the correct ranges that reveal a security is overbought or oversold. One these ranges have been established, the trader watches for the RSI to break out of the median range.
The Best Way to Approach RSI with Bitcoin
All technical analysis with securities is fallible and subject to error. This is why the smart trader will use multiple forms of technical analysis that can help to confirm one another. In other words, you would want to employ some of the following tools as you go about interpreting an RSI:
- Bollinger Bands
- Stochastic charts
- MACD indicator
- Support and resistance
Many traders maintain an extensive collection of charts. The advent of the personal computer has made keeping charts much easier. In the past, a trader would have to literally find printed charts and keep them for historical analysis. Today, all the trader needs to do is choose the selection of tools they want to use at their preferred cryptocurrency exchange.window of data will be useful. If you are a long-term investor, more data will be more effective.
Where to find an RSI for Bitcoin
There are services which allow traders to purchase charts for a nominal subscription fee. However, the best way to obtain your own RSI charts and other indicators will probably be to create an account with a cryptocurrency exchange. Most of these exchanges will offer a selection of tools for free when you create an account.
You will then be able to access your trading platform and customize it to display the charts that you need. Just choose the ones you want to work with and they will display at the bottom of the candlestick chart. Some traders like to place all of their tools on one chart so that they can get the big picture. For the new trader this can be confusing. It tends to clutter up the chart and make it hard to identify specific indicators.
Remember, the more historical data you have means a more accurate chart. You want as much data as possible, but the range of dates you require will probably depend upon your preferred style of trading. If you are a day trader, a short window of data will be useful. If you are a long-term investor, more data will be more effective.